


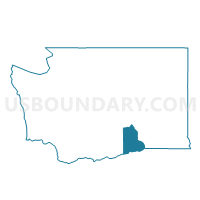
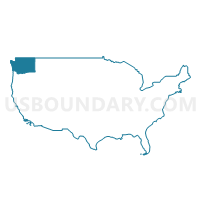
South Benton CCD, Benton County, Washington
About
Outline

Summary
| Unique Area Identifier | 155709 |
| Name | South Benton CCD |
| County | Benton County |
| State | Washington |
| Area (square miles) | 632.41 |
| Land Area (square miles) | 597.36 |
| Water Area (square miles) | 35.05 |
| % of Land Area | 94.46 |
| % of Water Area | 5.54 |
| Latitude of the Internal Point | 45.99798750 |
| Longtitude of the Internal Point | -119.48771430 |
| Total Population | 931 |
| Total Housing Units | 377 |
| Total Households | 318 |
| Median Age | 33.6 |
Maps

Graphs
Select a template below for downloading or customizing gragh for South Benton CCD, Benton County, Washington


Neighbors
Neighoring County Subdivision (by Name) Neighboring County Subdivision on the Map
- Boardman CCD, Morrow County, OR
- Burbank CCD, Walla Walla County, WA
- Hermiston-Umatilla CCD, Umatilla County, OR
- Horse Heaven Hills Plateau CCD, Klickitat County, WA
- Mabton CCD, Yakima County, WA
- Northwest Benton CCD, Benton County, WA
- Pendleton CCD, Umatilla County, OR
- Richland-Kennewick CCD, Benton County, WA
Top 10 Neighboring Unified School District (by Population) Neighboring Unified School District on the Map
- Kennewick School District, WA (85,577)
- Hermiston School District 8, OR (26,789)
- Prosser School District, WA (12,996)
- Morrow School District 1, OR (10,541)
- Kiona-Benton School District, WA (8,408)
- Umatilla School District 6, OR (6,368)
- Finley School District, WA (5,080)
- Columbia School District, WA (3,892)
- Mabton School District, WA (3,555)
- Paterson School District, WA (451)
Top 10 Neighboring State Legislative District Lower Chamber (by Population) Neighboring State Legislative District Lower Chamber on the Map
- State House District 16, WA (154,830)
- State House District 8, WA (149,474)
- State House District 15, WA (132,788)
- State House District 58, OR (62,100)
- State House District 57, OR (57,718)
Top 10 Neighboring State Legislative District Upper Chamber (by Population) Neighboring State Legislative District Upper Chamber on the Map
- State Senate District 16, WA (154,830)
- State Senate District 8, WA (149,474)
- State Senate District 15, WA (132,788)
- State Senate District 29, OR (119,818)
Top 10 Neighboring 111th Congressional District (by Population) Neighboring 111th Congressional District on the Map
- Congressional District 4, WA (774,409)
- Congressional District 2, OR (769,987)
- Congressional District 5, WA (723,609)
Top 10 Neighboring Census Tract (by Population) Neighboring Census Tract on the Map
- Census Tract 115.03, Benton County, WA (9,380)
- Census Tract 9501, Klickitat County, WA (8,325)
- Census Tract 9701, Morrow County, OR (7,997)
- Census Tract 9508, Umatilla County, OR (7,881)
- Census Tract 115.01, Benton County, WA (6,740)
- Census Tract 118, Benton County, WA (6,546)
- Census Tract 9504, Umatilla County, OR (6,256)
- Census Tract 9200, Walla Walla County, WA (5,224)
- Census Tract 9509, Umatilla County, OR (4,206)
- Census Tract 27.01, Yakima County, WA (3,440)
Top 10 Neighboring 5-Digit ZIP Code Tabulation Area (by Population) Neighboring 5-Digit ZIP Code Tabulation Area on the Map
- 99337, WA (29,845)
- 97838, OR (25,346)
- 99350, WA (12,979)
- 99338, WA (11,555)
- 99320, WA (9,201)
- 97882, OR (7,760)
- 98935, WA (4,190)
- 97844, OR (3,806)
- 99346, WA (352)
- 99356, WA (294)
Data
Demographic, Population, Households, and Housing Units
** Data sources from census 2010 **
Show Data on Map
Download Full List as CSV
Download Quick Sheet as CSV
| Subject | This Area | Benton County | Washington | National |
|---|---|---|---|---|
| POPULATION | ||||
| Total Population Map | 931 | 175,177 | 6,724,540 | 308,745,538 |
| POPULATION, HISPANIC OR LATINO ORIGIN | ||||
| Not Hispanic or Latino Map | 536 | 142,481 | 5,968,750 | 258,267,944 |
| Hispanic or Latino Map | 395 | 32,696 | 755,790 | 50,477,594 |
| POPULATION, RACE | ||||
| White alone Map | 688 | 144,418 | 5,196,362 | 223,553,265 |
| Black or African American alone Map | 0 | 2,221 | 240,042 | 38,929,319 |
| American Indian and Alaska Native alone Map | 14 | 1,574 | 103,869 | 2,932,248 |
| Asian alone Map | 0 | 4,691 | 481,067 | 14,674,252 |
| Native Hawaiian and Other Pacific Islander alone Map | 2 | 253 | 40,475 | 540,013 |
| Some Other Race alone Map | 203 | 15,798 | 349,799 | 19,107,368 |
| Two or More Races Map | 24 | 6,222 | 312,926 | 9,009,073 |
| POPULATION, SEX | ||||
| Male Map | 511 | 87,486 | 3,349,707 | 151,781,326 |
| Female Map | 420 | 87,691 | 3,374,833 | 156,964,212 |
| POPULATION, AGE (18 YEARS) | ||||
| 18 years and over Map | 658 | 127,513 | 5,143,186 | 234,564,071 |
| Under 18 years | 273 | 47,664 | 1,581,354 | 74,181,467 |
| POPULATION, AGE | ||||
| Under 5 years | 79 | 13,071 | 439,657 | 20,201,362 |
| 5 to 9 years | 71 | 13,081 | 429,877 | 20,348,657 |
| 10 to 14 years | 77 | 13,350 | 438,233 | 20,677,194 |
| 15 to 17 years | 46 | 8,162 | 273,587 | 12,954,254 |
| 18 and 19 years | 36 | 4,752 | 188,541 | 9,086,089 |
| 20 years | 12 | 2,174 | 94,086 | 4,519,129 |
| 21 years | 9 | 2,040 | 91,883 | 4,354,294 |
| 22 to 24 years | 32 | 6,741 | 275,543 | 12,712,576 |
| 25 to 29 years | 47 | 11,972 | 480,398 | 21,101,849 |
| 30 to 34 years | 79 | 11,066 | 453,383 | 19,962,099 |
| 35 to 39 years | 47 | 10,672 | 448,607 | 20,179,642 |
| 40 to 44 years | 52 | 11,062 | 459,698 | 20,890,964 |
| 45 to 49 years | 66 | 12,443 | 492,909 | 22,708,591 |
| 50 to 54 years | 70 | 12,624 | 495,296 | 22,298,125 |
| 55 to 59 years | 73 | 11,759 | 453,078 | 19,664,805 |
| 60 and 61 years | 19 | 4,200 | 162,454 | 7,113,727 |
| 62 to 64 years | 38 | 5,422 | 219,633 | 9,704,197 |
| 65 and 66 years | 19 | 2,946 | 119,417 | 5,319,902 |
| 67 to 69 years | 23 | 3,841 | 151,057 | 7,115,361 |
| 70 to 74 years | 17 | 4,728 | 186,746 | 9,278,166 |
| 75 to 79 years | 13 | 3,546 | 142,068 | 7,317,795 |
| 80 to 84 years | 4 | 2,747 | 111,118 | 5,743,327 |
| 85 years and over | 2 | 2,778 | 117,271 | 5,493,433 |
| MEDIAN AGE BY SEX | ||||
| Both sexes Map | 33.60 | 35.60 | 37.30 | 37.20 |
| Male Map | 33.60 | 34.60 | 36.20 | 35.80 |
| Female Map | 33.60 | 36.60 | 38.30 | 38.50 |
| HOUSEHOLDS | ||||
| Total Households Map | 318 | 65,304 | 2,620,076 | 116,716,292 |
| HOUSEHOLDS, HOUSEHOLD TYPE | ||||
| Family households: Map | 231 | 45,699 | 1,687,455 | 77,538,296 |
| Husband-wife family Map | 199 | 35,115 | 1,288,849 | 56,510,377 |
| Other family: Map | 32 | 10,584 | 398,606 | 21,027,919 |
| Male householder, no wife present Map | 24 | 3,330 | 124,402 | 5,777,570 |
| Female householder, no husband present Map | 8 | 7,254 | 274,204 | 15,250,349 |
| Nonfamily households: Map | 87 | 19,605 | 932,621 | 39,177,996 |
| Householder living alone Map | 73 | 15,872 | 711,619 | 31,204,909 |
| Householder not living alone Map | 14 | 3,733 | 221,002 | 7,973,087 |
| HOUSEHOLDS, HISPANIC OR LATINO ORIGIN OF HOUSEHOLDER | ||||
| Not Hispanic or Latino householder: Map | 228 | 57,321 | 2,431,191 | 103,254,926 |
| Hispanic or Latino householder: Map | 90 | 7,983 | 188,885 | 13,461,366 |
| HOUSEHOLDS, RACE OF HOUSEHOLDER | ||||
| Householder who is White alone | 266 | 56,964 | 2,165,468 | 89,754,352 |
| Householder who is Black or African American alone | 0 | 760 | 89,745 | 14,129,983 |
| Householder who is American Indian and Alaska Native alone | 7 | 556 | 34,018 | 939,707 |
| Householder who is Asian alone | 0 | 1,540 | 158,224 | 4,632,164 |
| Householder who is Native Hawaiian and Other Pacific Islander alone | 0 | 66 | 10,785 | 143,932 |
| Householder who is Some Other Race alone | 40 | 4,011 | 88,530 | 4,916,427 |
| Householder who is Two or More Races | 5 | 1,407 | 73,306 | 2,199,727 |
| HOUSEHOLDS, HOUSEHOLD TYPE BY HOUSEHOLD SIZE | ||||
| Family households: Map | 231 | 45,699 | 1,687,455 | 77,538,296 |
| 2-person household Map | 98 | 18,945 | 728,493 | 31,882,616 |
| 3-person household Map | 29 | 9,764 | 378,423 | 17,765,829 |
| 4-person household Map | 41 | 8,913 | 327,428 | 15,214,075 |
| 5-person household Map | 25 | 4,555 | 148,156 | 7,411,997 |
| 6-person household Map | 21 | 2,082 | 61,229 | 3,026,278 |
| 7-or-more-person household Map | 17 | 1,440 | 43,726 | 2,237,501 |
| Nonfamily households: Map | 87 | 19,605 | 932,621 | 39,177,996 |
| 1-person household Map | 73 | 15,872 | 711,619 | 31,204,909 |
| 2-person household Map | 14 | 3,106 | 175,739 | 6,360,012 |
| 3-person household Map | 0 | 428 | 27,974 | 992,156 |
| 4-person household Map | 0 | 124 | 10,832 | 411,171 |
| 5-person household Map | 0 | 50 | 3,737 | 126,634 |
| 6-person household Map | 0 | 14 | 1,543 | 48,421 |
| 7-or-more-person household Map | 0 | 11 | 1,177 | 34,693 |
| HOUSING UNITS | ||||
| Total Housing Units Map | 377 | 68,618 | 2,885,677 | 131,704,730 |
| HOUSING UNITS, OCCUPANCY STATUS | ||||
| Occupied Map | 318 | 65,304 | 2,620,076 | 116,716,292 |
| Vacant Map | 59 | 3,314 | 265,601 | 14,988,438 |
| HOUSING UNITS, OCCUPIED, TENURE | ||||
| Owned with a mortgage or a loan Map | 100 | 32,060 | 1,245,264 | 52,979,430 |
| Owned free and clear Map | 102 | 12,522 | 428,656 | 23,006,644 |
| Renter occupied Map | 116 | 20,722 | 946,156 | 40,730,218 |
| HOUSING UNITS, VACANT, VACANCY STATUS | ||||
| For rent Map | 8 | 1,084 | 72,112 | 4,137,567 |
| Rented, not occupied Map | 1 | 129 | 4,877 | 206,825 |
| For sale only Map | 0 | 611 | 41,417 | 1,896,796 |
| Sold, not occupied Map | 0 | 219 | 7,623 | 421,032 |
| For seasonal, recreational, or occasional use Map | 39 | 474 | 89,907 | 4,649,298 |
| For migrant workers Map | 1 | 11 | 1,328 | 24,161 |
| Other vacant Map | 10 | 786 | 48,337 | 3,652,759 |
| HOUSING UNITS, OCCUPIED, AVERAGE HOUSEHOLD SIZE BY TENURE | ||||
| Total: Map | 2.93 | 2.66 | 2.51 | 2.58 |
| Owner occupied Map | 2.83 | 2.74 | 2.61 | 2.65 |
| Renter occupied Map | 3.09 | 2.50 | 2.35 | 2.44 |
| HOUSING UNITS, OCCUPIED, TENURE BY RACE OF HOUSEHOLDER | ||||
| Owner occupied: Map | 202 | 44,582 | 1,673,920 | 75,986,074 |
| Householder who is White alone Map | 177 | 40,516 | 1,453,731 | 63,446,275 |
| Householder who is Black or African American alone Map | 0 | 305 | 31,936 | 6,261,464 |
| Householder who is American Indian and Alaska Native alone Map | 3 | 329 | 16,941 | 509,588 |
| Householder who is Asian alone Map | 0 | 949 | 97,333 | 2,688,861 |
| Householder who is Native Hawaiian and Other Pacific Islander alone Map | 0 | 37 | 4,112 | 61,911 |
| Householder who is Some Other Race alone Map | 19 | 1,703 | 35,463 | 1,975,817 |
| Householder who is Two or More Races Map | 3 | 743 | 34,404 | 1,042,158 |
| Renter occupied: Map | 116 | 20,722 | 946,156 | 40,730,218 |
| Householder who is White alone Map | 89 | 16,448 | 711,737 | 26,308,077 |
| Householder who is Black or African American alone Map | 0 | 455 | 57,809 | 7,868,519 |
| Householder who is American Indian and Alaska Native alone Map | 4 | 227 | 17,077 | 430,119 |
| Householder who is Asian alone Map | 0 | 591 | 60,891 | 1,943,303 |
| Householder who is Native Hawaiian and Other Pacific Islander alone Map | 0 | 29 | 6,673 | 82,021 |
| Householder who is Some Other Race alone Map | 21 | 2,308 | 53,067 | 2,940,610 |
| Householder who is Two or More Races Map | 2 | 664 | 38,902 | 1,157,569 |
| HOUSING UNITS, OCCUPIED, TENURE BY HISPANIC OR LATINO ORIGIN OF HOUSEHOLDER | ||||
| Owner occupied: Map | 202 | 44,582 | 1,673,920 | 75,986,074 |
| Not Hispanic or Latino householder Map | 162 | 40,986 | 1,592,994 | 69,617,625 |
| Hispanic or Latino householder Map | 40 | 3,596 | 80,926 | 6,368,449 |
| Renter occupied: Map | 116 | 20,722 | 946,156 | 40,730,218 |
| Not Hispanic or Latino householder Map | 66 | 16,335 | 838,197 | 33,637,301 |
| Hispanic or Latino householder Map | 50 | 4,387 | 107,959 | 7,092,917 |
| HOUSING UNITS, OCCUPIED, TENURE BY HOUSEHOLD SIZE | ||||
| Owner occupied: Map | 202 | 44,582 | 1,673,920 | 75,986,074 |
| 1-person household Map | 45 | 8,382 | 353,279 | 16,453,569 |
| 2-person household Map | 80 | 16,964 | 646,313 | 27,618,605 |
| 3-person household Map | 20 | 7,049 | 268,039 | 12,517,563 |
| 4-person household Map | 22 | 6,605 | 238,736 | 10,998,793 |
| 5-person household Map | 10 | 3,212 | 100,123 | 5,057,765 |
| 6-person household Map | 14 | 1,400 | 39,967 | 1,965,796 |
| 7-or-more-person household Map | 11 | 970 | 27,463 | 1,373,983 |
| Renter occupied: Map | 116 | 20,722 | 946,156 | 40,730,218 |
| 1-person household Map | 28 | 7,490 | 358,340 | 14,751,340 |
| 2-person household Map | 32 | 5,087 | 257,919 | 10,624,023 |
| 3-person household Map | 9 | 3,143 | 138,358 | 6,240,422 |
| 4-person household Map | 19 | 2,432 | 99,524 | 4,626,453 |
| 5-person household Map | 15 | 1,393 | 51,770 | 2,480,866 |
| 6-person household Map | 7 | 696 | 22,805 | 1,108,903 |
| 7-or-more-person household Map | 6 | 481 | 17,440 | 898,211 |
Loading...